
Overview
The research at a glance
Throughout the project, the PO wanted to know one thing: how to change the product to make it better. This question breaks down into two parts: which users to start with, and what to change.
The research was split into three phases, each answering part of this question:
| Phase 1: First survey | Phase 2: Qualitative research | Phase 3: Second survey | |
|---|---|---|---|
| Led by | DS team | User Researcher (me) | User Researcher (me) and DS |
| Goal | Roughly segment users by their starting purpose (their purpose when they started using the service), and find the causes of low NPS | Understand who users without urgency were and what they were dissatisfied with in the product | Estimate the share of each user type and identify what each was dissatisfied with in the product |
| Results | Based on starting purpose, users without urgency were estimated to be the majority; identified the rating items most strongly correlated with NPS for each group | Found that users without urgency couldn’t be unified into a single persona, and that low NPS didn’t mean low satisfaction | Showed where the three types fit in the overall user base and their shares; identified the items worth prioritizing when improving the product for each group; overturned the hypotheses from the qualitative research |
| Impact on the next phase | Started the research with users without urgency; carried the rating items over to the interview guide | Set the next goal of estimating what share of all users each of the three types represented; switched the evaluation metric from NPS to satisfaction | Compiled into a report that became one of the inputs for the department’s decision to adjust its investment in individual users |
Background: two threads
Thread 1: An overturned hypothesis
GLOBIS Unlimited’s original persona was a group of users with “vague learning goals”: they wanted to improve their knowledge and skills but had no clear, urgent problems to solve. This persona was created by the PO, Customer Success, and customer support staff based on their understanding of users, and it became the shared persona across the department.
We had always believed that even these users had problems that hadn’t yet surfaced. If we showed them how people in similar situations applied what they learned at work, they would become aware of their own problems and start learning actively.
To test this, the PO and a UX Researcher colleague ran a concept test, but it barely resonated with participants. This shook the team’s long-held belief, suggesting that users’ motivation to learn doesn’t necessarily come from problems at work. The team began to wonder: who made up the majority of our users, and what motivated them to use our product?
Thread 2: The causes of low NPS
Around the same time, the department’s data science (DS) team found through a survey that NPS was correlated with continued learning. The team wanted to find out why users gave low scores, as a starting point for improving the product.
Phase 1: The first survey—my starting point when I took over
The DS team then ran another survey that asked about users’ starting purpose to roughly segment them by urgency, while also asking about NPS and a set of rating items. The analysis included only users who had just started using the service.
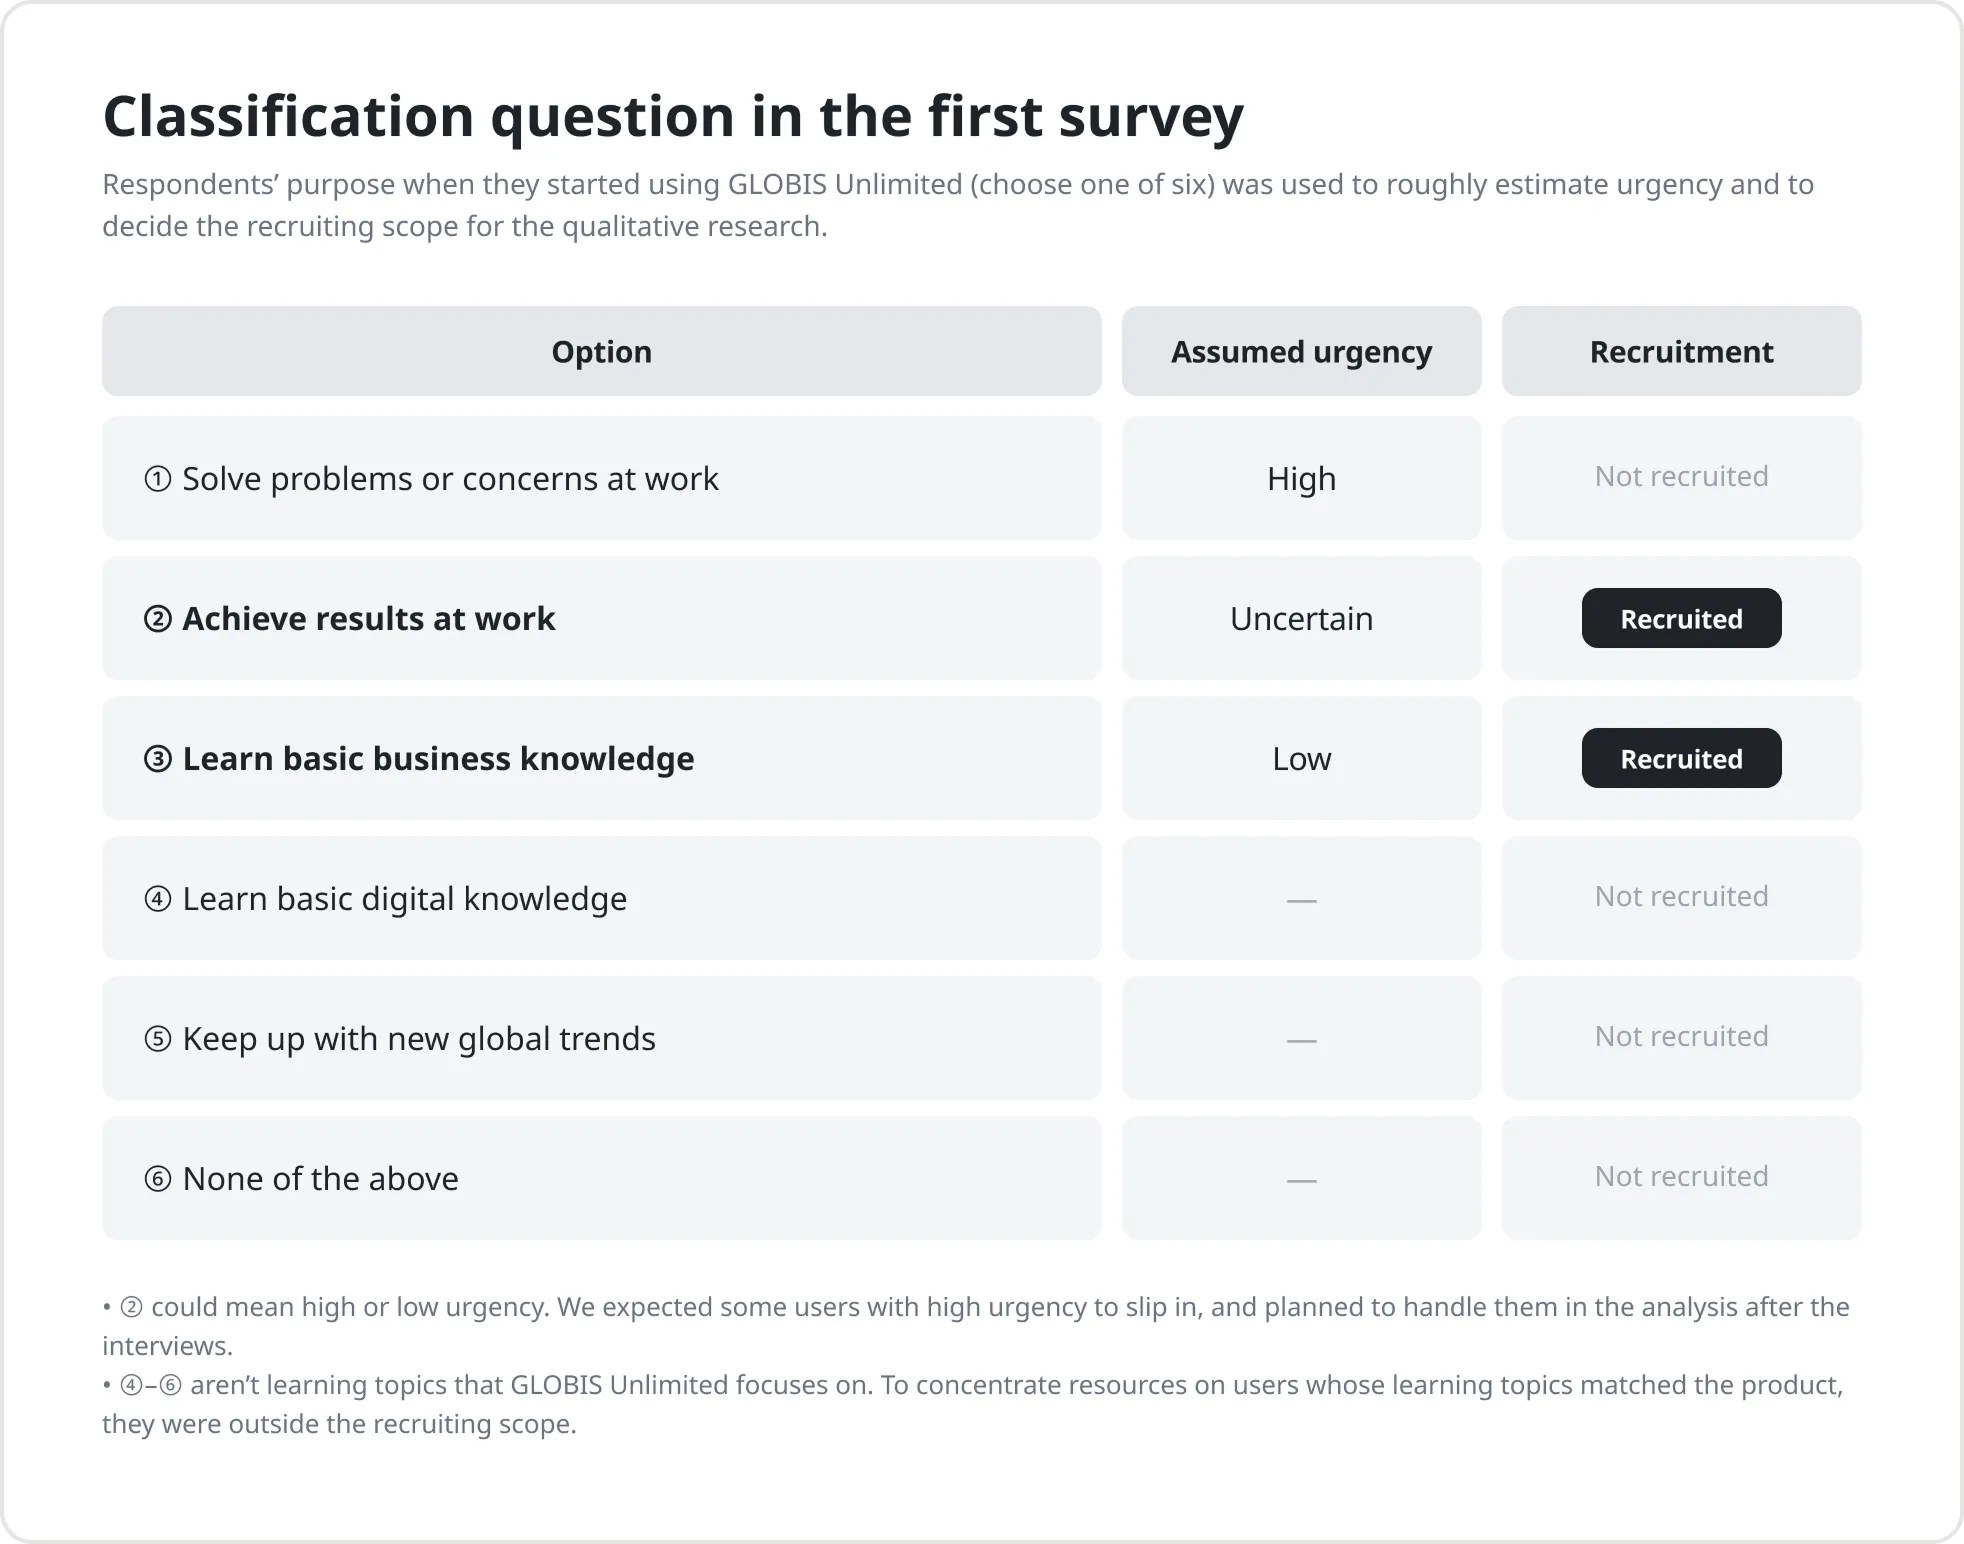
The survey estimated that users without urgency made up the majority. It also identified the rating items most strongly correlated with NPS for each group, and these rating items were later used directly in the interview guide for the qualitative research.
Bringing the two threads together
After taking over, I decided to start with users without urgency, for two reasons:
- The survey estimated that they were the majority, so improving the product with them as the starting point would have the greatest impact.
- They likely corresponded to the product’s original persona: the users with vague learning goals. Because the survey segmented users only by their starting purpose, we couldn’t be sure the two matched exactly. But the concept test had overturned the original hypothesis, and the PO needed to quickly find another starting point to get these users learning actively.
So I set the following goals for Phase 2:
- Build a persona of users without urgency through qualitative research (who they were)
- Find out what they were dissatisfied with in the product (a starting point for improving the product)
- Confirm their share with a survey once this group was clearly defined
Phase 2: Qualitative research
Recruiting: criteria and rationale
I recruited participants from the respondents to the first survey, using two criteria:
- Medium or low urgency: Phase 2 aimed to understand users without urgency. Respondents who chose “Learn basic business knowledge” were assumed to have low urgency. Those who chose “Achieve results at work” could have high or low urgency, but they were included as well (see below for why).
- Medium or low NPS (passives and detractors): The other goal of Phase 2 was to find out what users were dissatisfied with in the product. Promoters, who gave high scores, usually felt less dissatisfaction, so they weren’t included.
Non-target users we expected to slip in were excluded during analysis
The first survey deliberately avoided asking users directly about their subjective feelings (for example, “How urgently do you need to learn for your work right now, on a scale of 0 to 10?”). People’s judgments about themselves are often inaccurate, so asking directly yields unreliable results. Instead, the survey used a more objective fact—their starting purpose—to infer their urgency. The trade-off, which the DS team was aware of when designing the survey, was that this question couldn’t clearly separate people with different levels of urgency.
So when recruiting, we expected that some respondents who chose “Achieve results at work” would have more urgency than our target—for example, people who had actually come to the service to solve an urgent problem. Rather than screening them out during recruiting, we planned to exclude them during the analysis after the interviews.
Interview design: context first, scores last
The interviews were held online and lasted about 60 minutes each. Either the DS or I moderated each session while the other of us took notes.
Asking participants to recreate how they used the service
I asked participants to share their screens and walk through the last time they used GLOBIS Unlimited. When relying on memory alone, people tend to leave out details. Having them actually go through it again let us see what they really did, such as how they decided which video to watch.
The trade-offs of question order
Phase 2 had two goals: understanding who participants were, and finding out what they were dissatisfied with in the product. We compared two ways to design the interview guide, which differed in whether to ask about context first or NPS first:
- Context first, NPS and rating items last: This captures participants’ overall assessment after they have reflected on their experience, and lets us explore context in depth. The trade-off is that the scores can easily be influenced by impressions from what was discussed during the interview.
- NPS and rating items first, then the reasons behind the scores: This captures participants’ intuitive first impressions and makes their dissatisfaction clear. The trade-off is that participants’ later answers tend to drift toward the scores they just gave.
In the end, we chose the first approach. We already had participants’ NPS from the earlier survey, so what the interviews needed was not the score itself but the qualitative insights behind it. Having participants first recreate and reflect on how they used the service, and only then confirm with NPS and the rating items, let them describe the product’s strengths and weaknesses, and the context behind them, based on the concrete experiences they had just recalled.
Analysis: from transcripts to personas for three types
1. Behavioral variable analysis: figuring out how many groups participants fell into
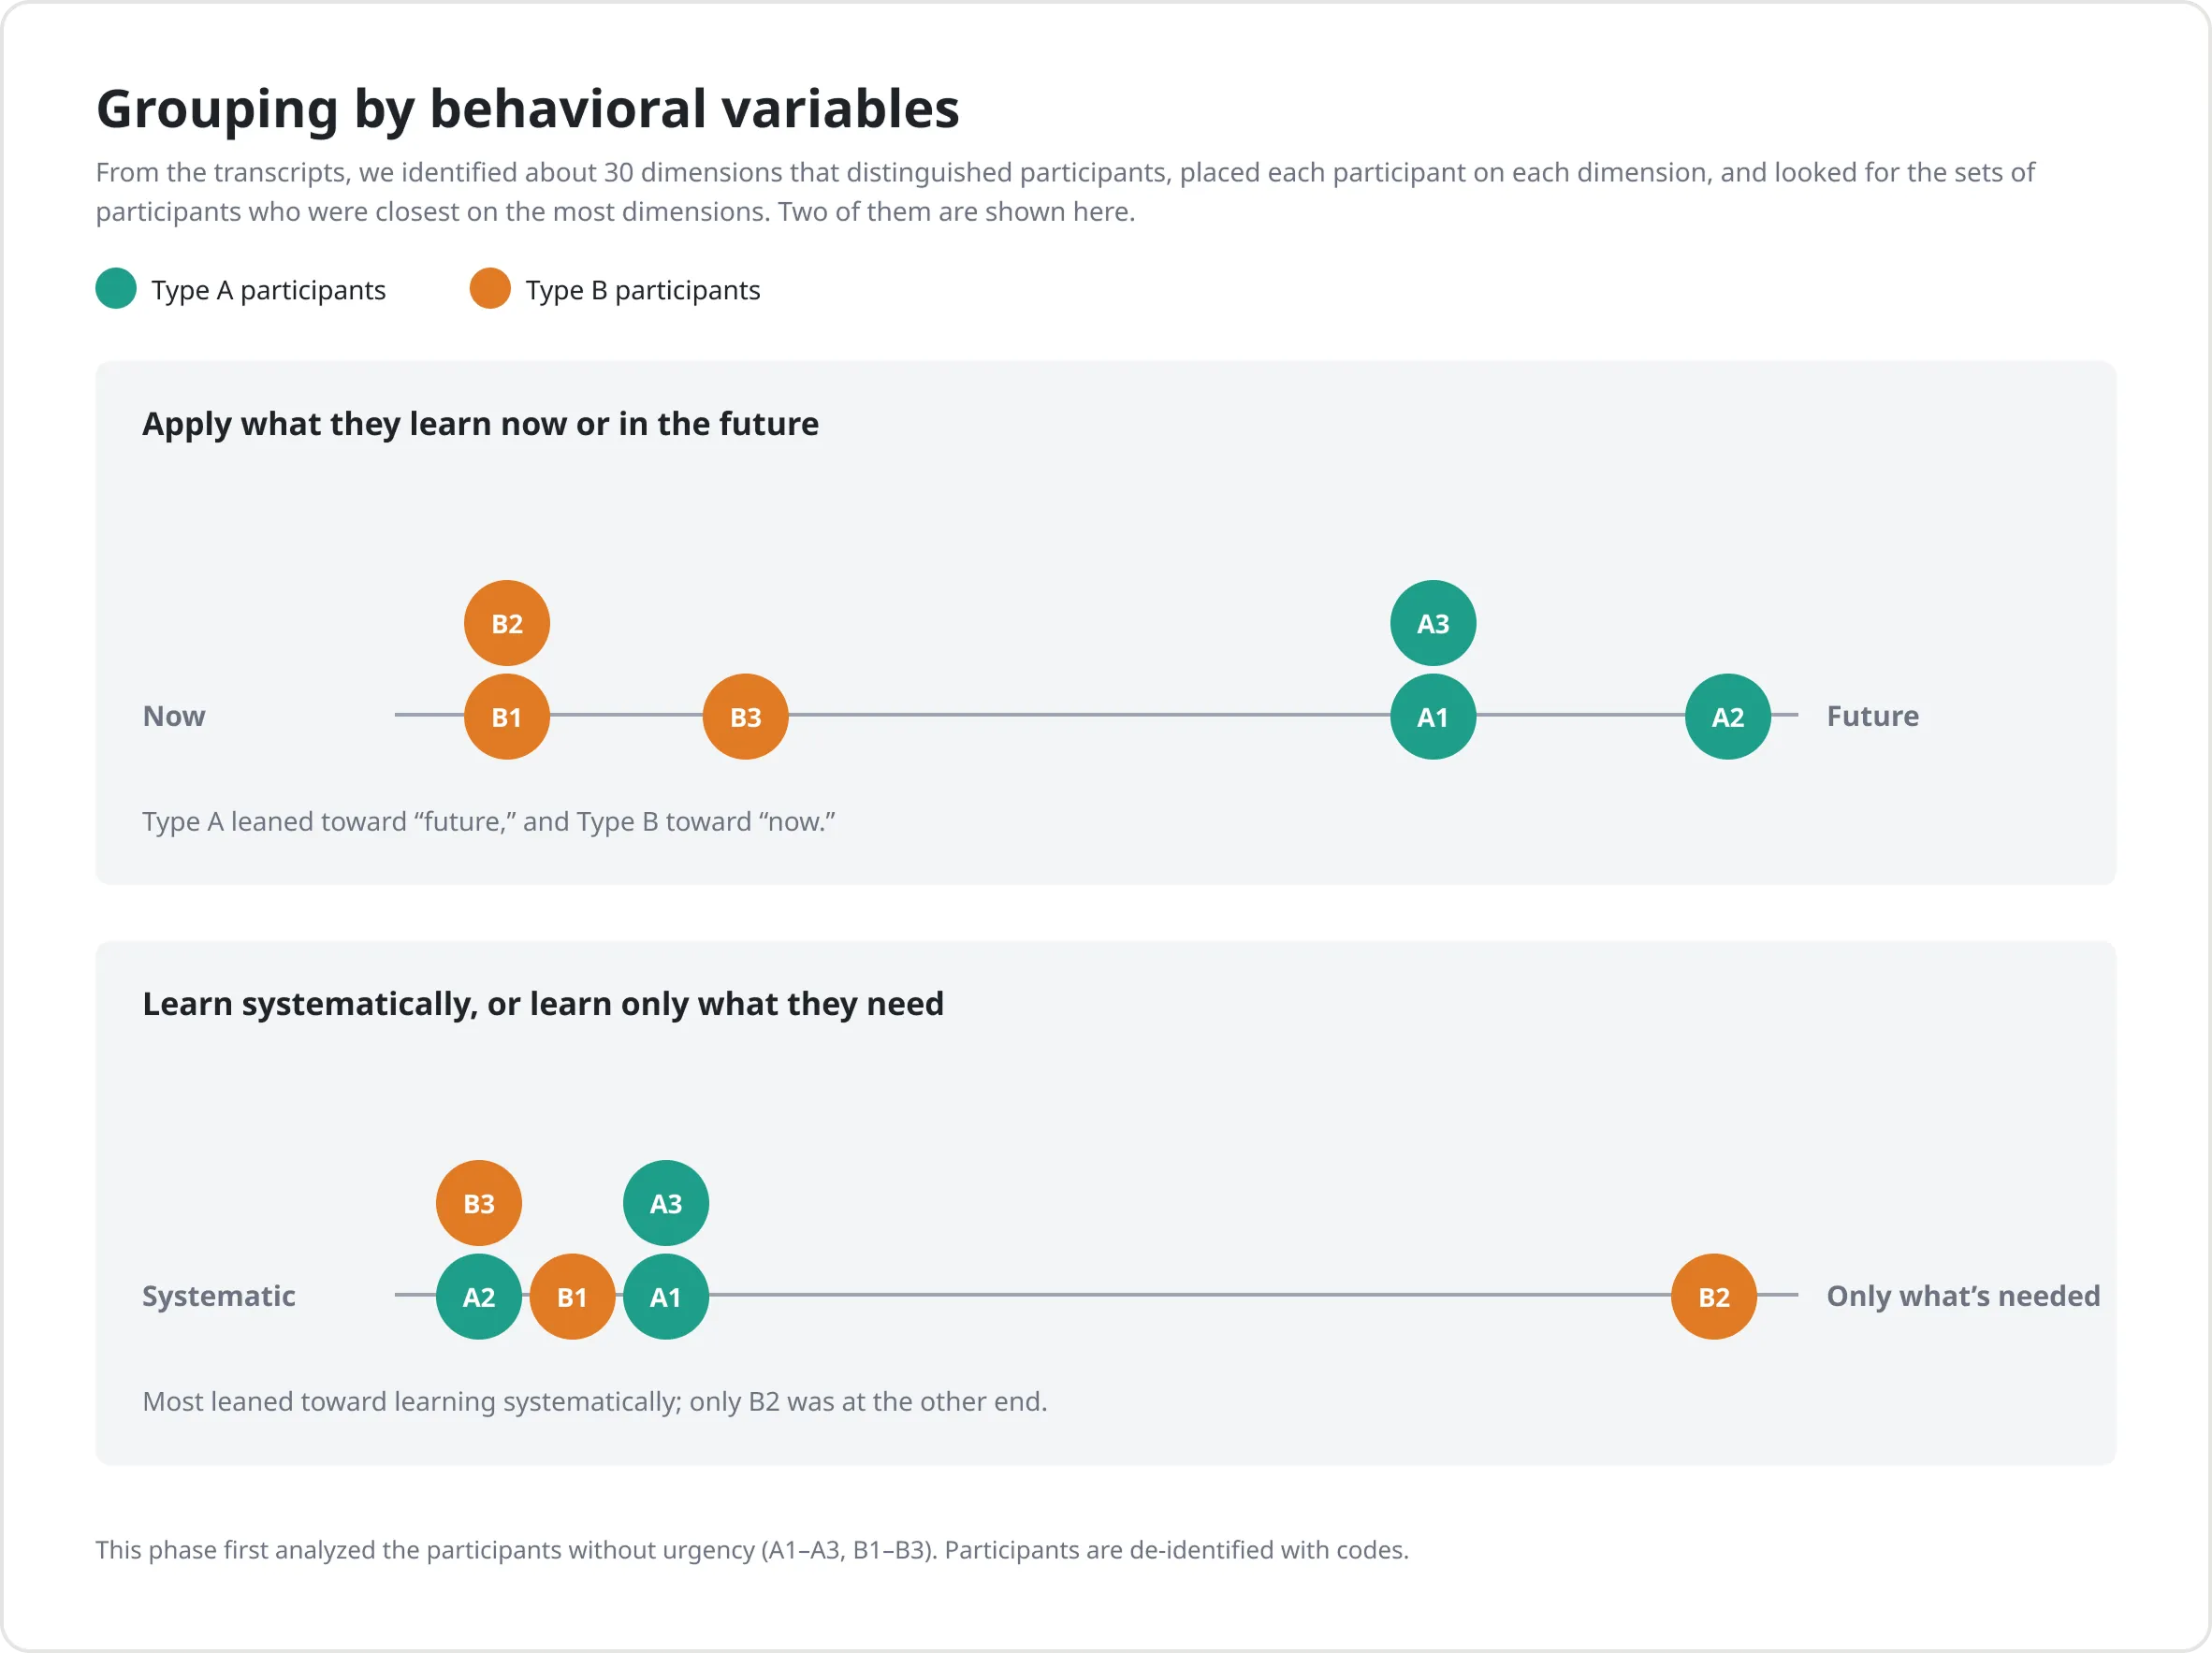
Right after the interviews, before we started analyzing, we noticed that the participants without urgency recruited from the survey didn’t seem to fit into a single group. To determine, on solid grounds, how many groups they could be divided into, the other researcher, the DS, and I each read the transcripts closely and identified characteristics that distinguished participants, which we used as dimensions. We then placed each participant on each dimension and looked for the sets of participants who were closest to one another on the most dimensions. These became the basis for grouping participants and choosing core participants.
2. The KA method: finding values that stay close to what participants said
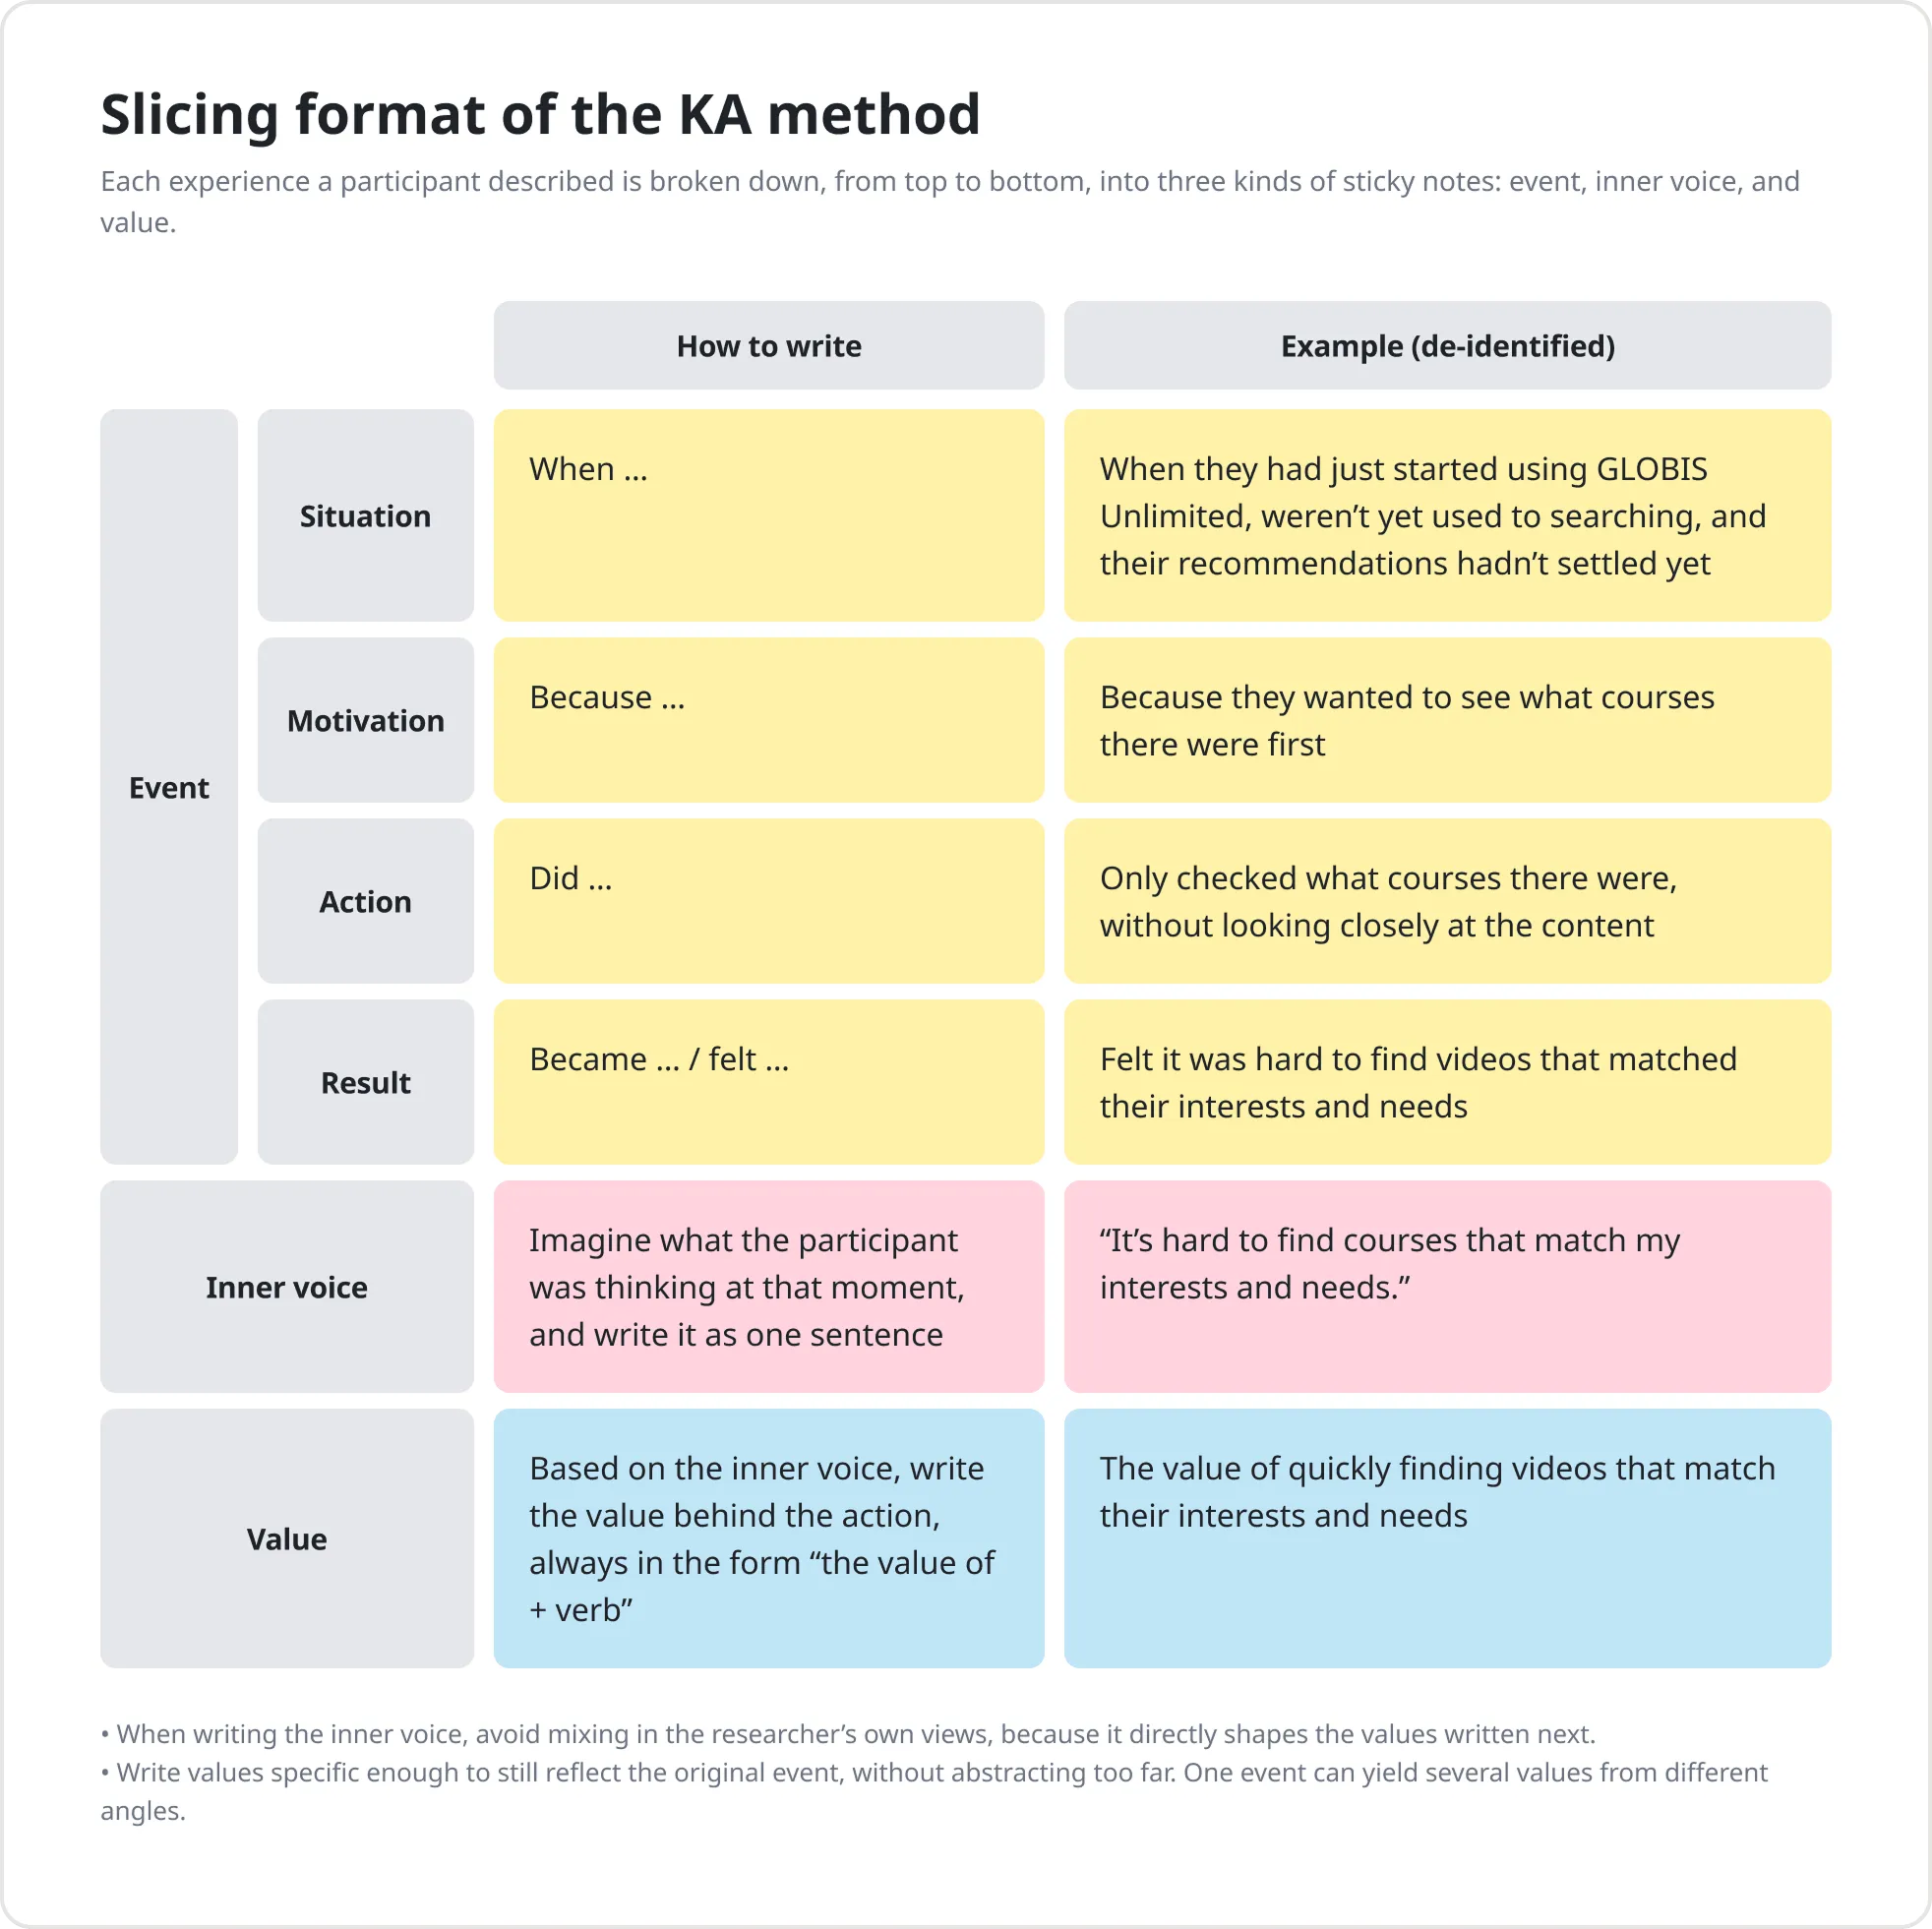
Interview transcripts contain a large volume of data, mixing different kinds of content such as participants’ words and actions, situations, and context. Grouping them directly with affinity diagramming, or trying to derive values from them, would have been too labor-intensive and made it hard to draw conclusions. So we first used the KA method, a qualitative analysis method developed in Japan that breaks each experience in an interview into an event, an inner voice, and a value. With it, we identified values at the finest level of detail, close to what participants actually said. In the analysis, we prioritized participants confirmed to be without urgency (our original target).
3. Value maps: organizing values according to the research goals
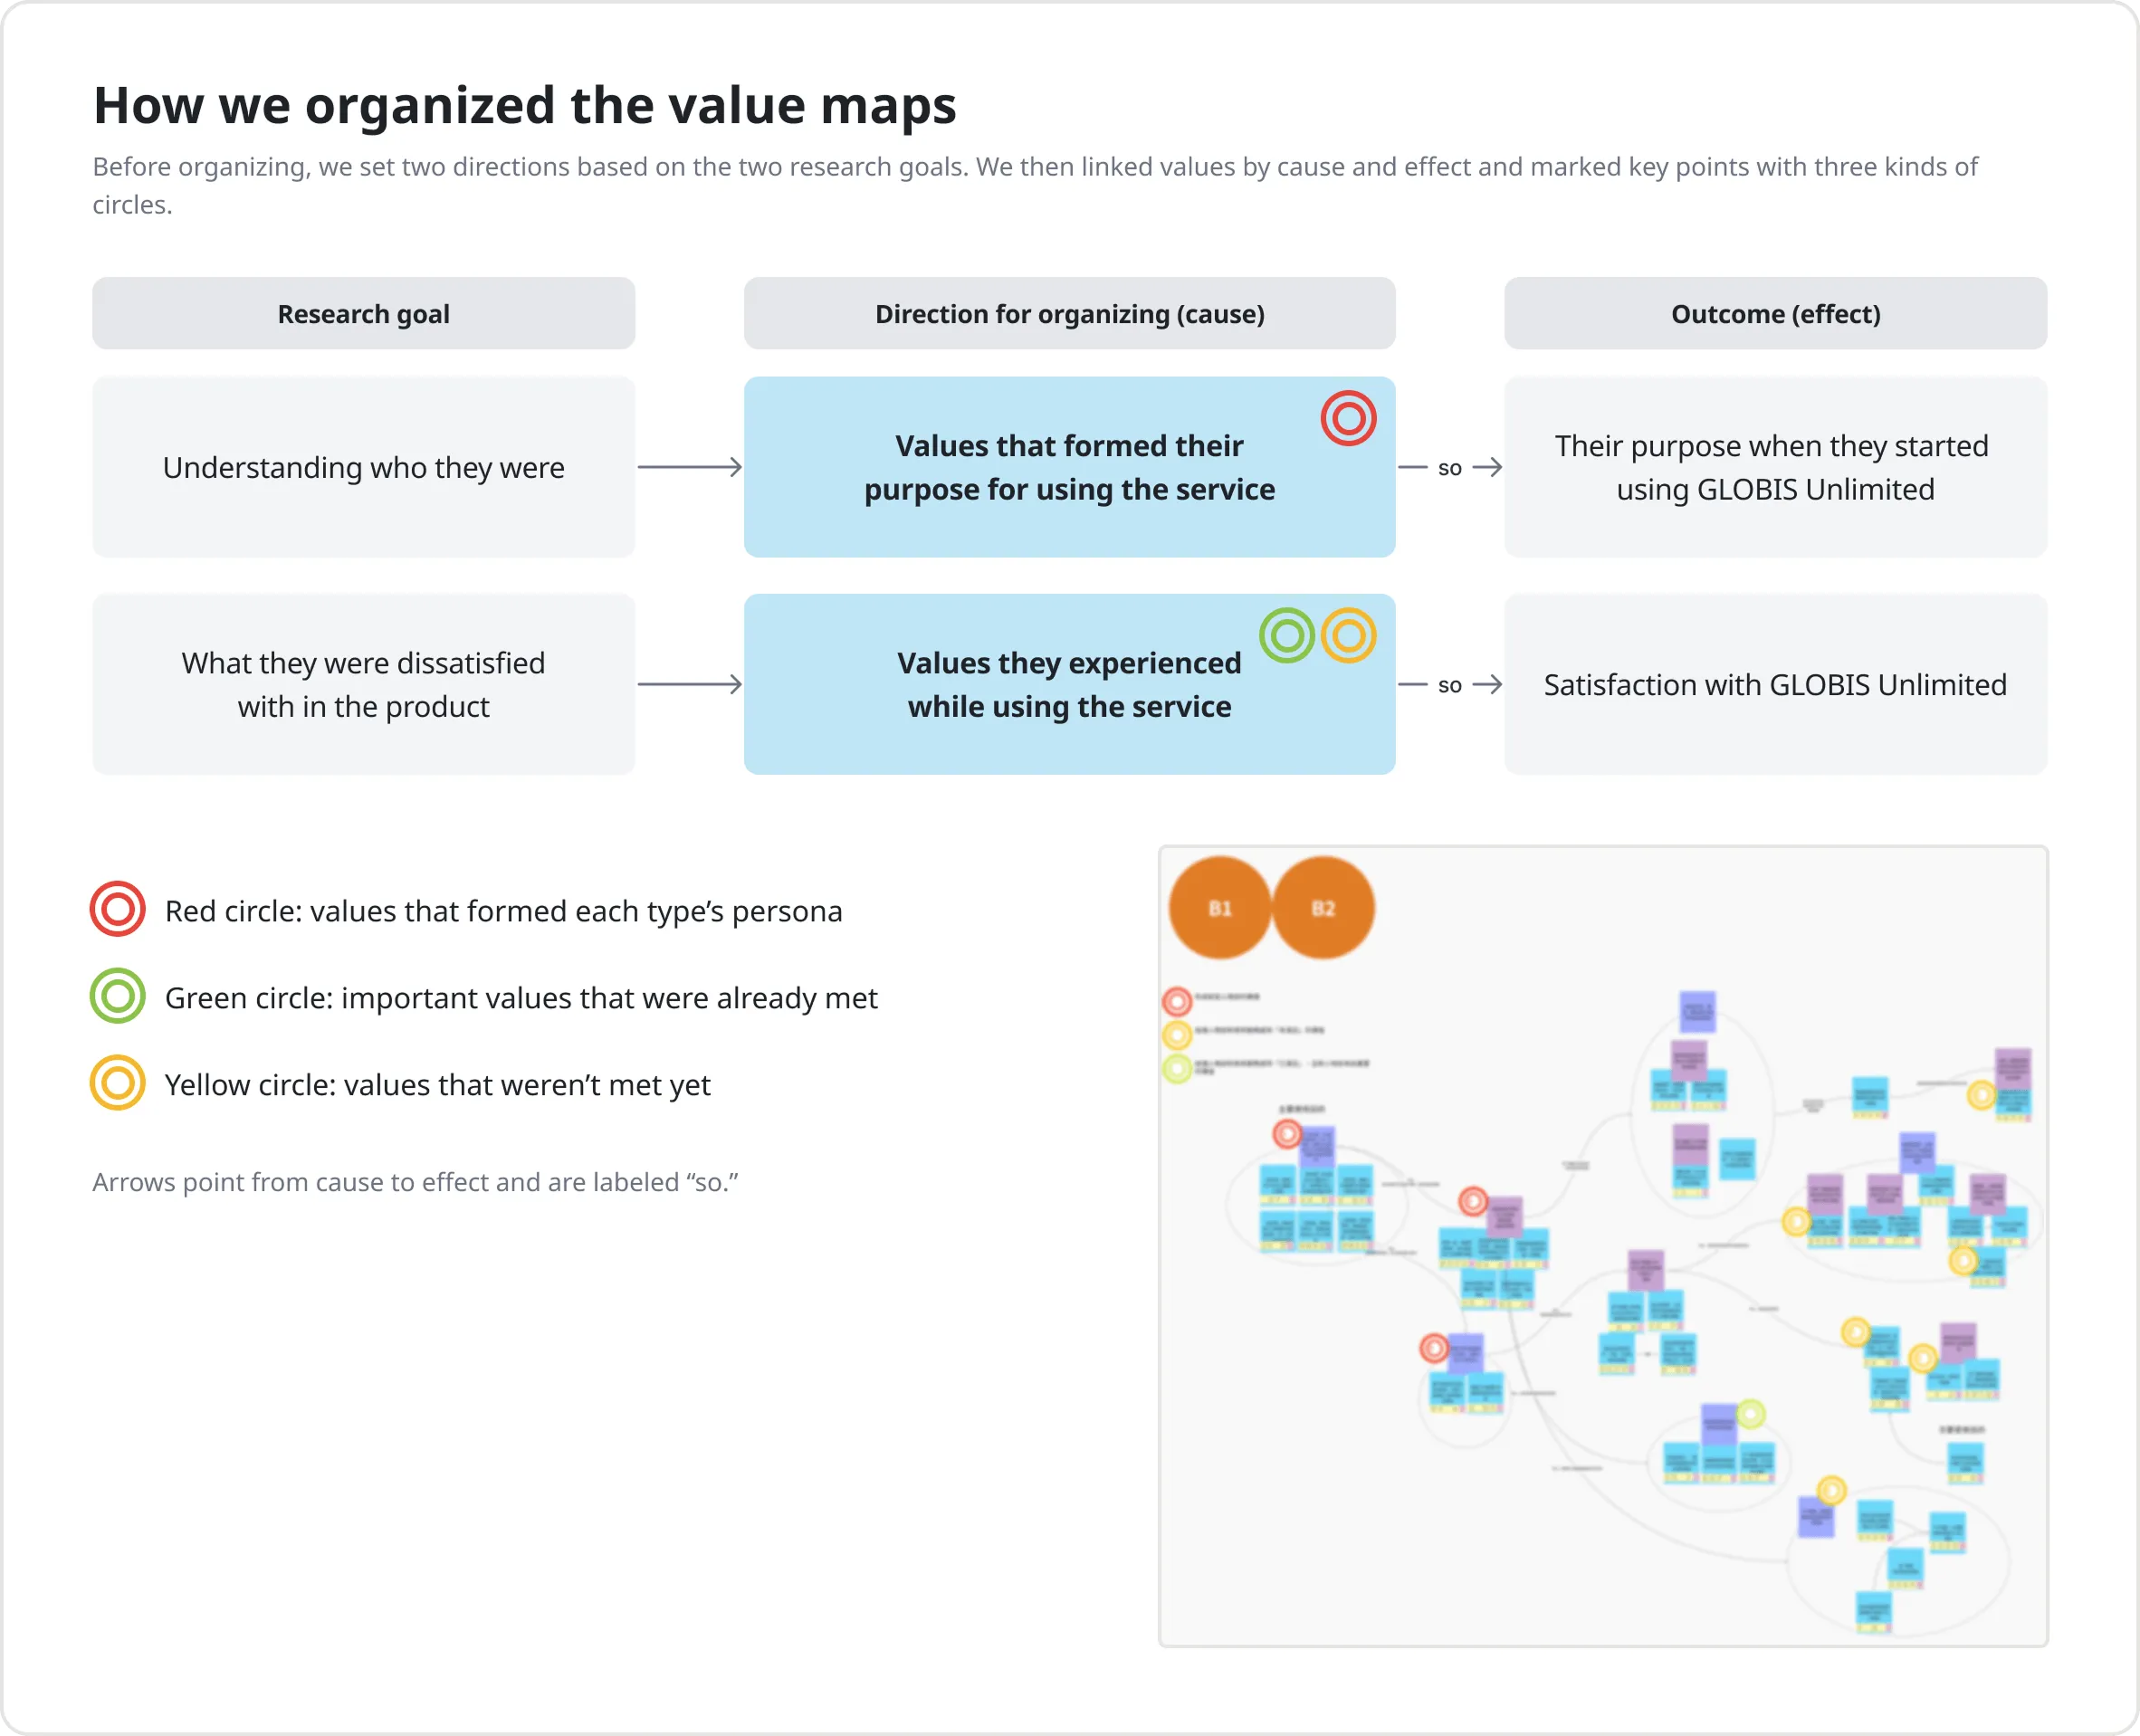
We then organized the values found with the KA method into value maps, linking values by cause and effect to show which values were behind participants’ actions.
Without a direction set in advance, it’s easy for whoever organizes the map to shape participants’ values around their own subjective views. So I set two directions for organizing the value maps, based on the two goals of Phase 2:
- Values that formed their purpose for using the service (for understanding who they were): What values led them to become this type of user?
- Values they experienced while using the service (for finding out what they were dissatisfied with in the product): What values did they experience when using GLOBIS Unlimited? Which were met and which weren’t, and how did that lead to the satisfaction scores they gave?
4. Personas for the three types
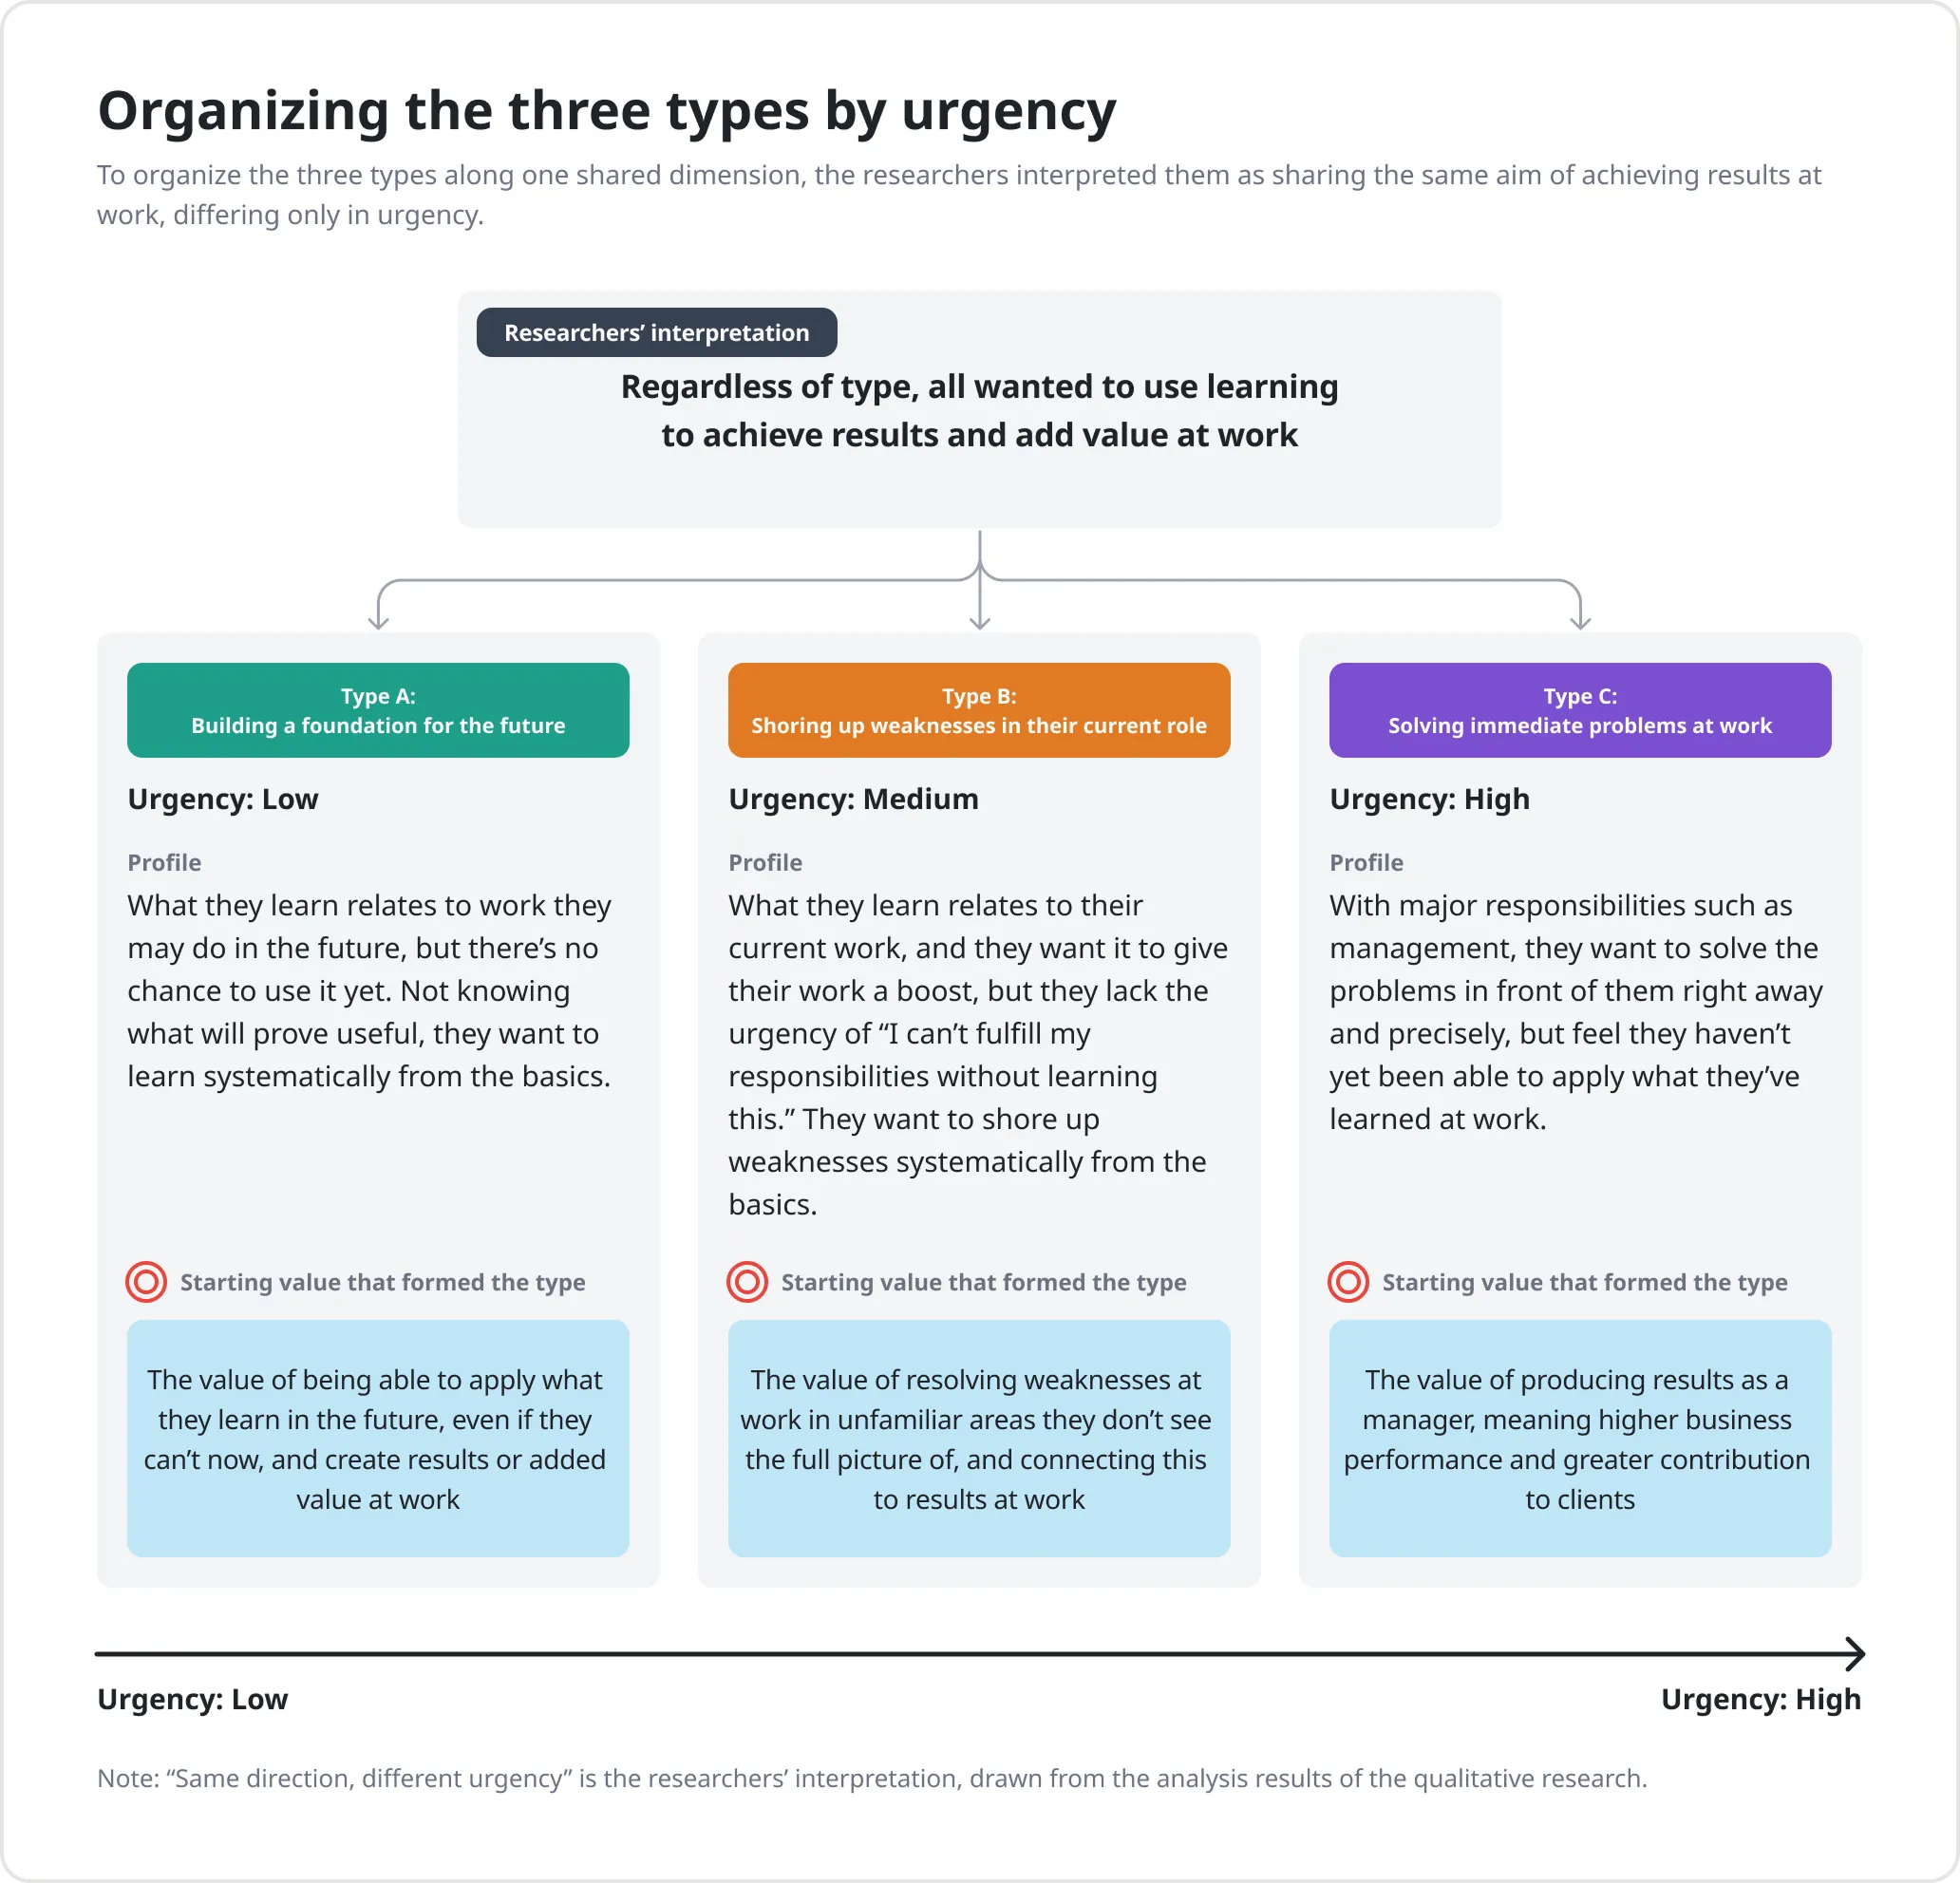
Among the many behavioral variables, we looked for a dimension that could connect the three types and explain how they related to each other, and in the end chose “urgency to apply what they learn at work.” Our interpretation was that all three types shared the same aim of achieving results at work; what differed was their urgency.
What we were looking for was an axis that could segment the user base: the next survey would use it to divide respondents into groups and compare each group’s share and what each group was dissatisfied with in the product. If each type were identified by its own set of criteria, a respondent might fit two types or none, and the groups’ shares and ratings couldn’t be compared with one another.
Two findings that changed the goals of the next phase
Finding 1: Users without urgency weren’t all the same
We had assumed that users without urgency could be captured in one persona, and that understanding them qualitatively would reveal a starting point for improving the product.
In practice, the participants recruited under the “without urgency” criterion fell into three types. Even among those without urgency, there were two types, Types A and B; and, as we had expected during recruiting, some had high urgency (Type C): among those who chose “Achieve results at work” were users who truly had urgency. Users with urgency weren’t originally part of Phase 2’s scope, but once we built a persona for them as well, the three types could be distinguished along the single dimension of urgency, which made our explanation complete.
The personas and value maps for the three types already showed us candidates for improvement for each type. What we needed to know next was what share of all users each of the three types represented, so we would know how much impact improving the product for each type would have.
Finding 2: Low NPS didn’t mean dissatisfaction
We had used low NPS scores as a clue to understanding participants’ dissatisfaction with the product. But in the interviews, we found that the detractors we interviewed weren’t necessarily dissatisfied with the service. Their reason for giving low scores was often that “there’s no one around me to recommend it to.”
During the interviews, after asking about NPS, we also asked participants to rate their satisfaction on the same 0–10 scale, and they generally rated it higher than NPS. “Not recommending” is hard to change by improving the product; what the team really needed, and could actually change, was dissatisfaction during use. So we switched the evaluation metric for the next phase to satisfaction.
Before moving on to Phase 3, we first completed the analysis of Type C so that all three types had complete qualitative profiles, and only then began designing the survey based on them.
Phase 3: The second survey—turning qualitative findings into survey questions
The goal of this phase was to estimate the share of each of the three types and to use satisfaction to identify dissatisfaction during use.
Survey design
I designed the survey together with the DS, focusing on two points:
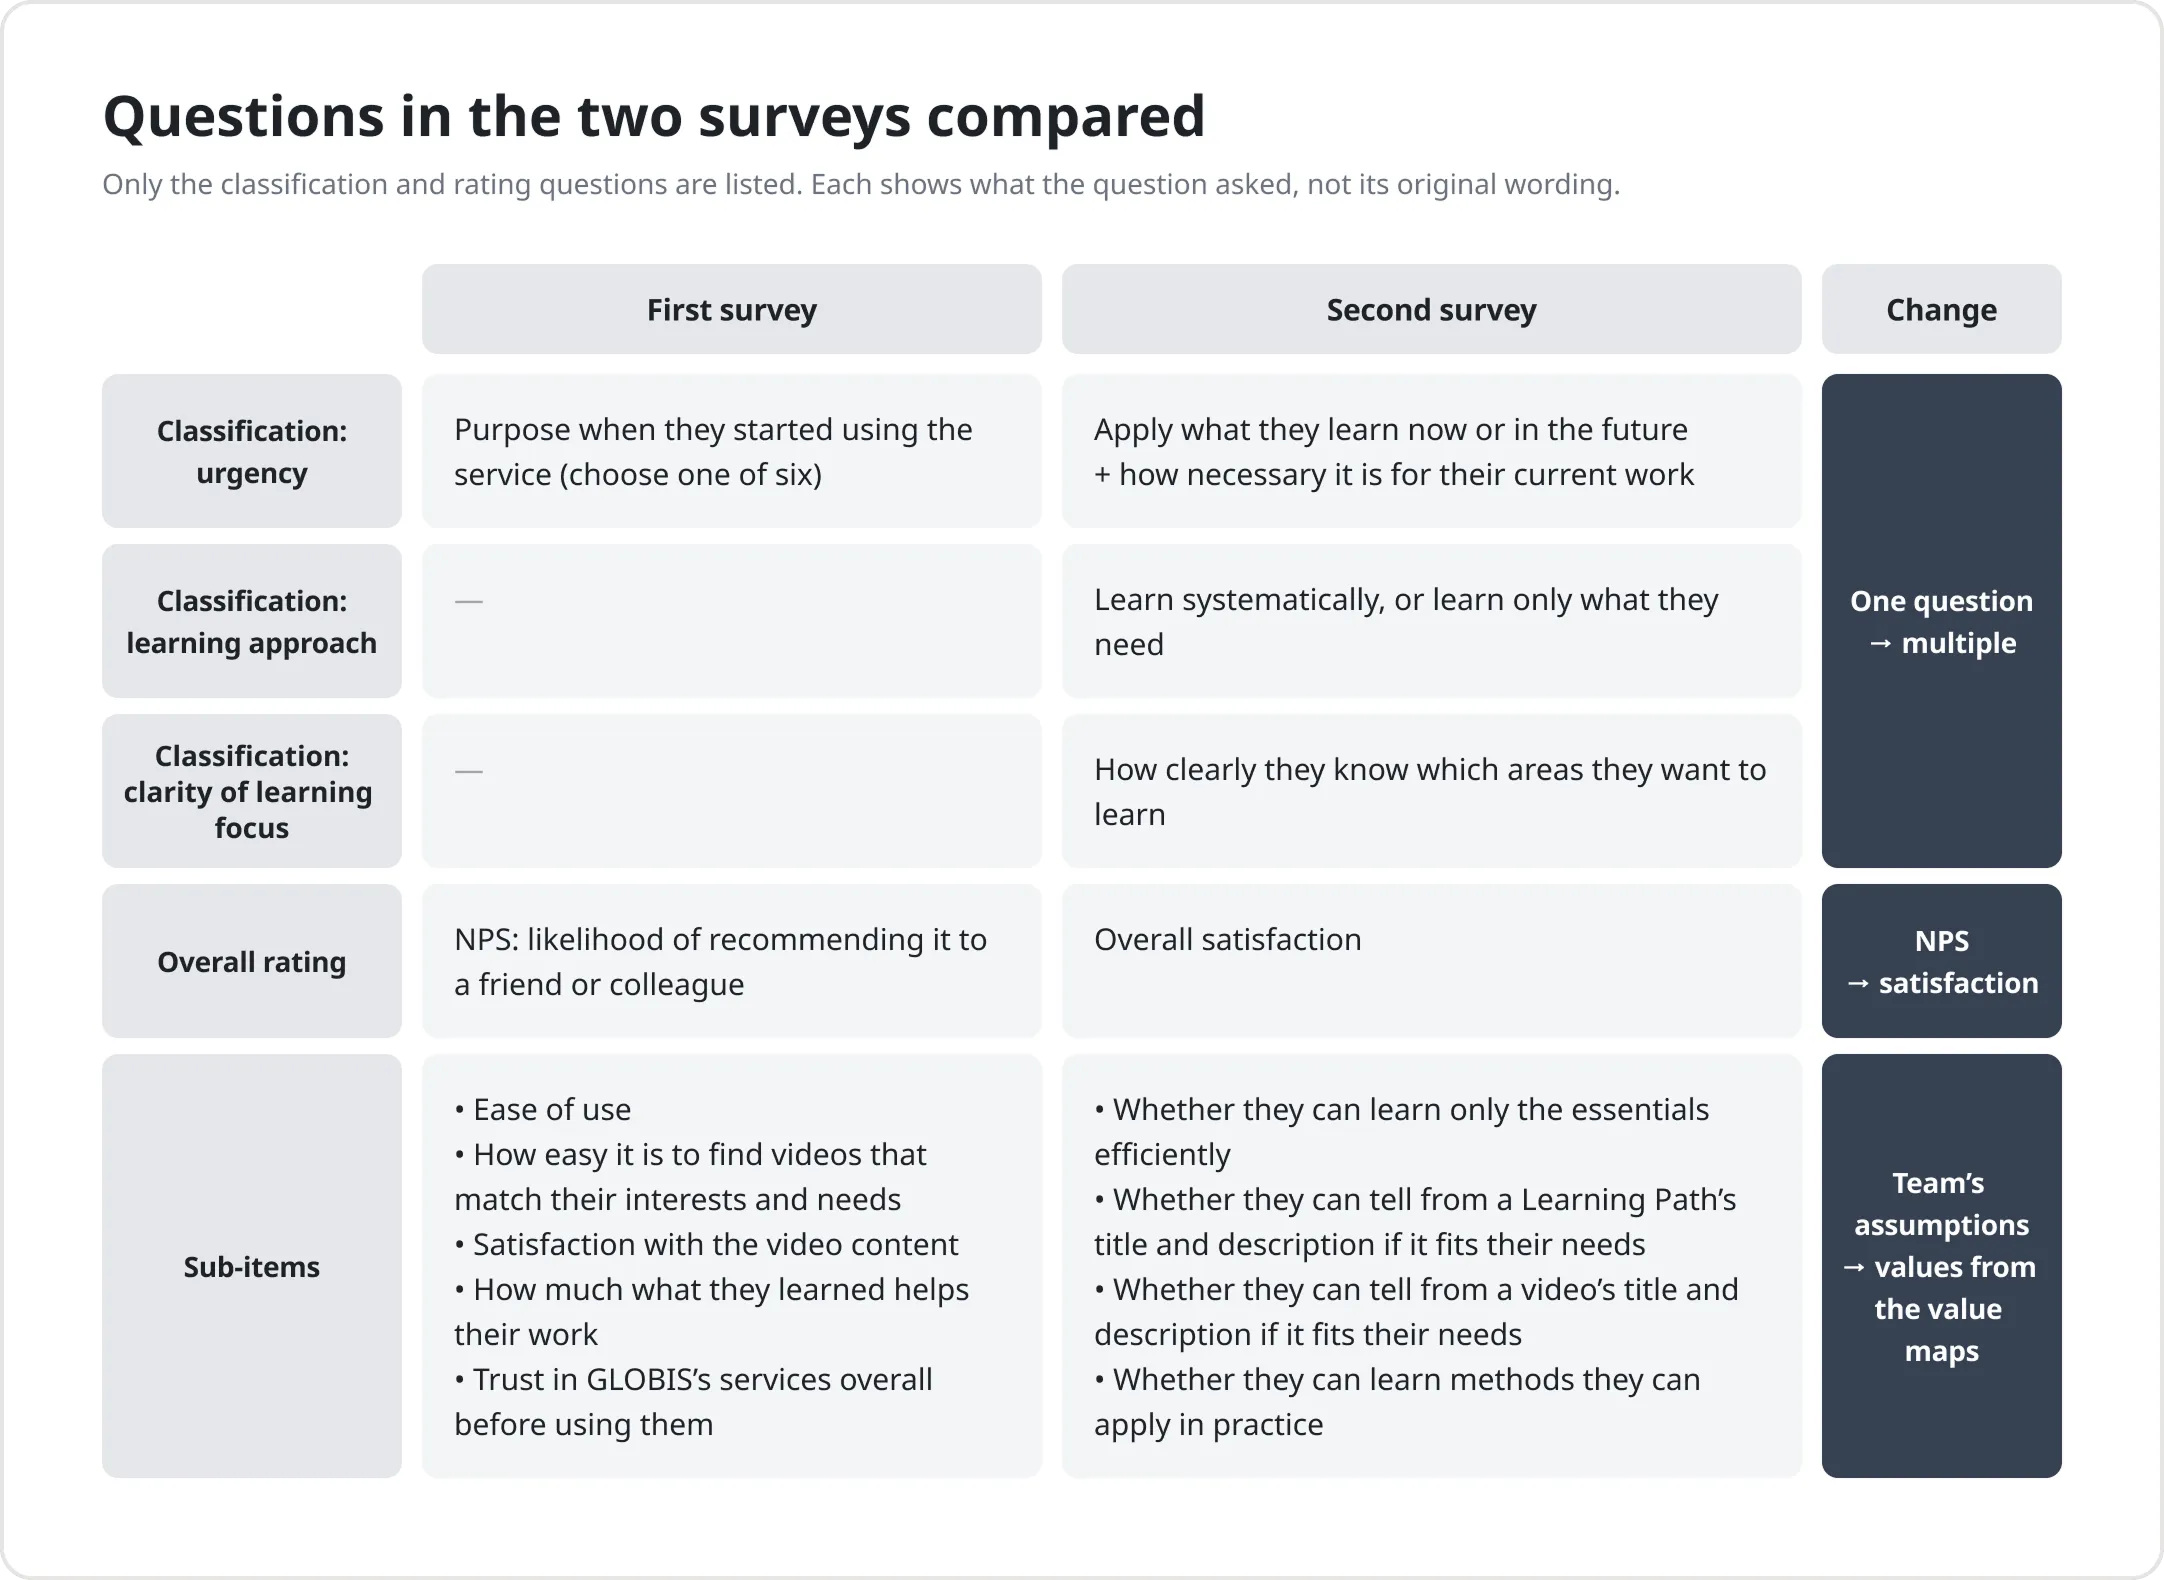
- No longer estimating urgency from a single question: When the first survey was designed, there were no qualitative findings to draw on, so urgency could only be roughly estimated from starting purpose. As a result, it didn’t separate people finely enough; for example, any kind of user might choose “Achieve results at work.” The qualitative research showed us that urgency was mainly reflected in two things: whether people wanted to apply what they learned now or in the future, and how necessary it was for their current work. This time, we asked about both and combined the answers to determine urgency. We also included other characteristics that seemed related to urgency in the qualitative research, such as whether people wanted to learn systematically or learn only what they needed (hereafter, learning approach) and how clearly they knew which areas they wanted to learn. This let us analyze which factors were actually strongly correlated with urgency.
- Satisfaction sub-items written directly from the values found in the value maps: The rating items in the first survey were chosen by the team before the research, based on its own understanding of users. This time, we used the values the qualitative research had actually found.
Results
- Most users lacked urgency.
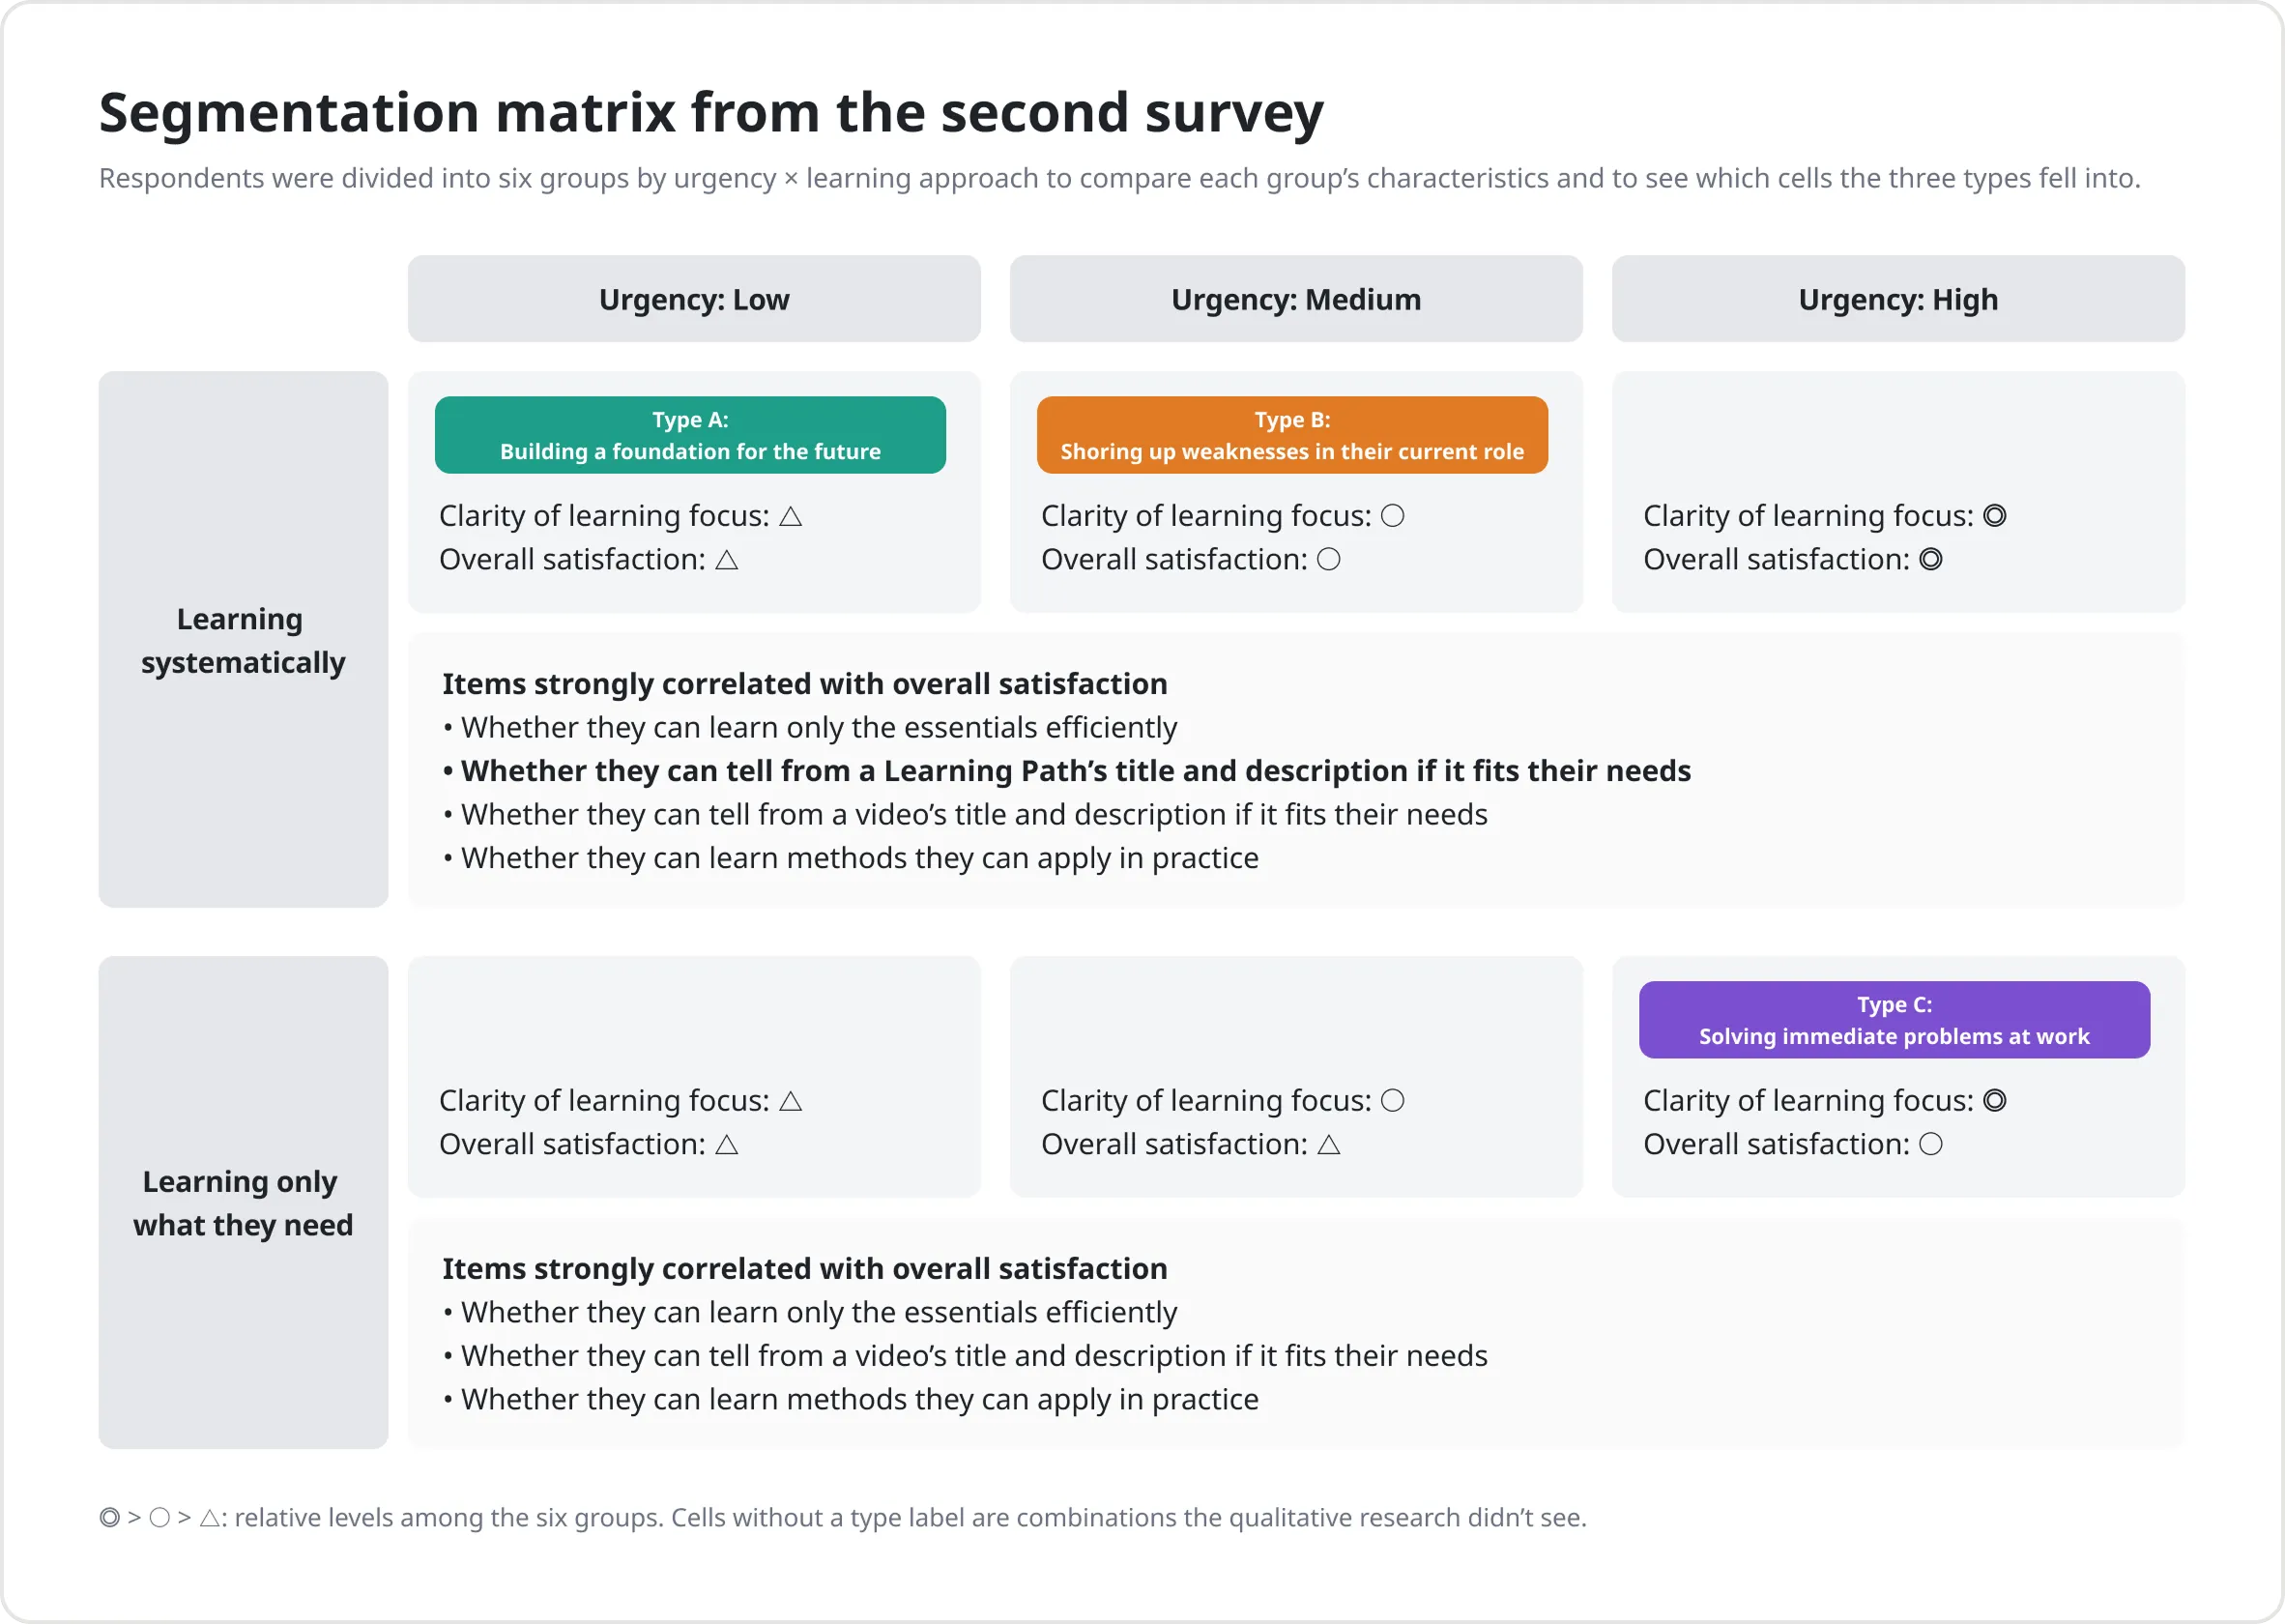
- Learning approach wasn’t related to urgency: We had expected learning approach to be related to urgency, so we designed the survey with urgency as the single main axis. The survey showed that the two didn’t have the relationship we had seen in the qualitative research; learning approach seemed to be more of a personal habit or preference. So we changed the segmentation to two axes: urgency and learning approach. On the other hand, how clearly users knew which areas they wanted to learn was strongly correlated with urgency: the higher their urgency, the more clearly they knew which areas they wanted to learn.
- The two learning approaches valued different items: Among the satisfaction sub-items strongly correlated with overall satisfaction, users who learned systematically had one item that users who learned only what they needed didn’t: “whether they could tell from a Learning Path’s title and description if it fit their needs.” These strongly correlated items are candidates worth prioritizing for improvement.
- The three types covered only part of the user base: When we matched the definitions of the three types against the survey’s segmentation, each type corresponded to one cell of the grid formed by urgency and learning approach. But the survey also found combinations the qualitative research hadn’t seen, such as users without urgency who learned only what they needed.
- The relationship between urgency and satisfaction was the opposite of what we saw in the qualitative research: In the satisfaction scores we asked for during the interviews, the higher a participant’s urgency, the lower their satisfaction. The survey showed the opposite: the higher the urgency, the higher the satisfaction.
Outcomes and what happened next
Together with the DS, I reported the results to the PO and department leadership: I presented the qualitative research, and the DS presented the quantitative part.
Although this research didn’t directly influence specific product decisions, it became one of the inputs—along with the team’s other validation work with individual users—for the department’s later decision to adjust its investment in individual users. (This was a department-wide decision, not one led by the research team.)
Looking back
- Using NPS as a screening criterion meant the detractors we recruited weren’t necessarily dissatisfied with the service
If we had added a satisfaction question at screening, we could have noticed the gap between NPS and satisfaction earlier, and recruited people who were truly dissatisfied with the service. In fact, the qualitative research didn’t find any participants whose satisfaction was truly low. We planned another round of recruiting specifically to find such people, but the department changed direction shortly after the second survey, so it never took place. - Both relationships we saw in the qualitative research were overturned by the survey
In the qualitative research, users with urgency tended to learn only what they needed, and the higher their urgency, the lower their satisfaction. The survey, however, showed that learning approach wasn’t related to urgency, and that the relationship between urgency and satisfaction was the opposite. With only a limited number of participants analyzed in depth, there was always a risk of seeing relationships that don’t hold across the overall user base. As for the second relationship (between urgency and satisfaction), looking back, I think the recruiting criteria may also have been one of the causes. We recruited only NPS passives and detractors, so the users with urgency who slipped in were, from the start, people who had given a low NPS score; users with urgency who gave a high NPS score were never recruited. Although NPS and satisfaction diverged, I suspect they weren’t entirely unrelated, so this criterion probably also screened out users with high satisfaction to some extent.
This was bad news for our original hypotheses, but precisely because the survey was built on the qualitative research, we could see the real shares and relationships. - Weighing two imperfect metrics
NPS was correlated with continued learning, and in interviews we could ask about the reasons behind the score. In a quantitative survey, however, it was influenced by other factors, such as having no one around to recommend the service to. Satisfaction was closer to what we wanted to know and involved fewer uncertainties in interpretation, but its relationship with continued learning hadn’t been verified. We chose satisfaction and planned to verify that relationship by tracking respondents’ later activity, as had been done with the earlier survey, but this, too, never took place because the department changed direction.